Debugging ReactJS applications with JetBrains WebStorm with Chrome and working breakpoints.
I struggled a bit debugging a React web application within WebStorm. In the end it is not very complicated, the only thing you need to do is to create two debug configurations. One for the „npm“ part and also a JavaScript debug configuration.
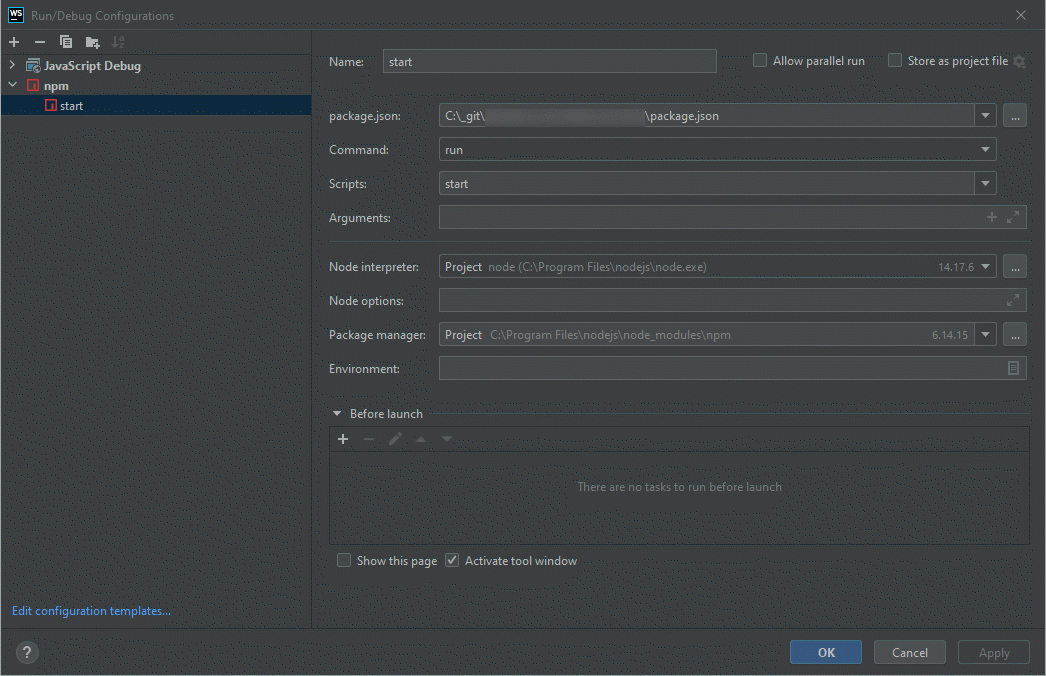
Here is my config for the npm part, which generates and starts the application.
The other is for JavaScript debugging with Chrome.

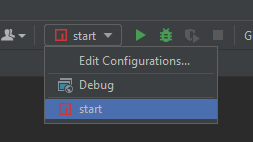
To debug the application, we first have to run the „npm“ configuration. This can be left running in the background.

Once this is started and running, we can start the JavaScript debug configuration.

And well thats it!