How to debug JavaScript and inspect HTML in Autodesk Fusion.
Currently, I am working on a Plugin for Autodesk Fusion, with some HTML interface, and I was wondering how to debug and inspect the HTML part of the application. Here is some info.
When you start an application / addin in Autodesk Fusion you should be able to remote debug the application. For example, you can open „localhost:1234“ in Chrome or Edge in order to connect to the internal browser from Fusion. Fusion uses some browser called Neutron, but it is basically some Chromium browser.
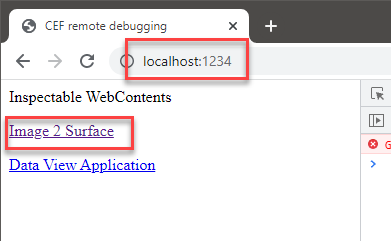
As you can see this opens a screen where you can select the application. Once you click on the application, the dev tools from Chrome should connect. However, I had a problem.
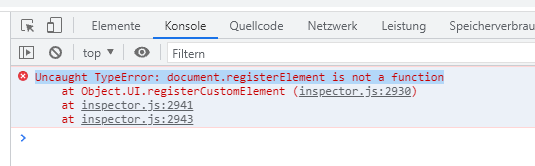
inspector.js:2930 Uncaught TypeError: document.registerElement is not a function
    at Object.UI.registerCustomElement (inspector.js:2930)
    at inspector.js:2941
    at inspector.js:2943
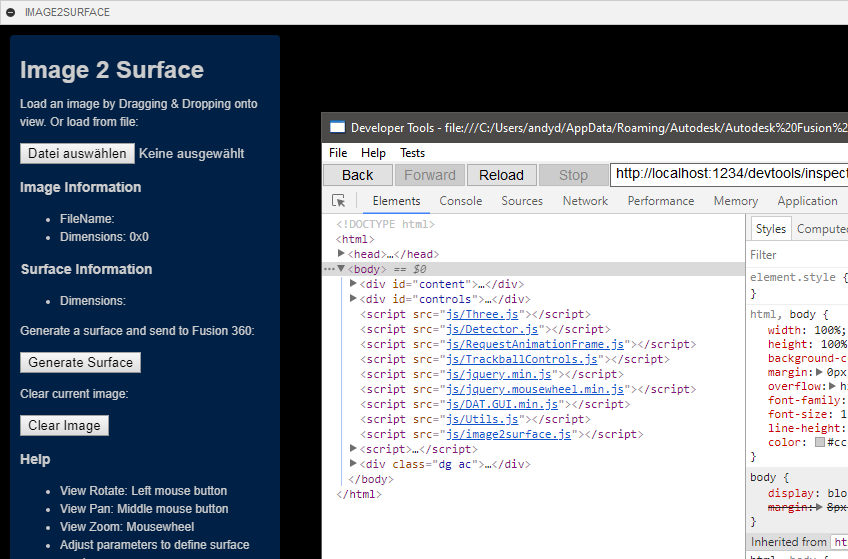
After some research on the internet, it was recommended to use the CEF client from the following GitHub Project:
https://github.com/Adobe-CEP/CEP-Resources/tree/master/CEP_9.x/
Just download the Cef client for your operating system and run it. With the client I was able to connect, debug and inspect the application.
Audodesk Fusion browser debugging, app not showing up
Since this worked for my test addin, it did not work for the addin I was working on. So there is another way to connect, which also worked with the installed Edge browser. This might be the better way to debug anyway.
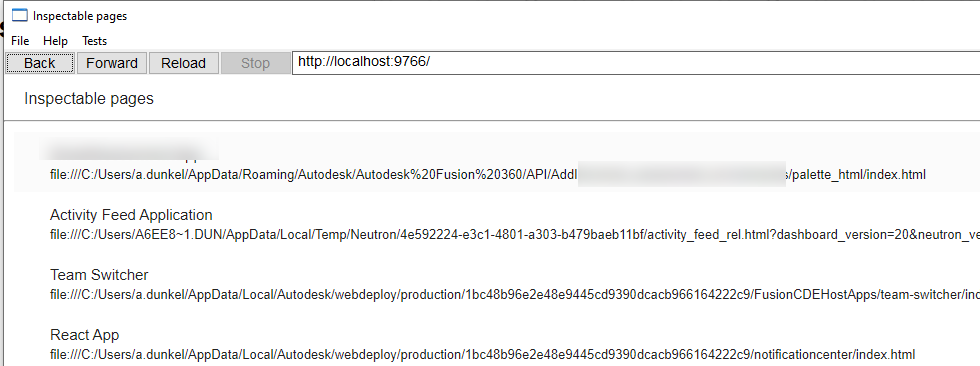
OK, so open „http://localhost:9766“ and then the open HTML pages will be shown. You can click on them and should now also be able to debug and inspect the HTML page.